Stepwise approach to debug 🎭 Playwright test written in TypeScript within the VS Code
Introduction
Debugging is integral to test automation development, enabling the identification and resolution of issues within your code, thereby ensuring the smooth execution of your tests.
The VS Code IDE offers a robust debugging feature, allowing you to step through code, set breakpoints, and analyze variables effectively.
We assume that you have basic knowledge of TypeScript or JavaScript and the VS Code IDE.
Step 1: Create a test automation script
Let’s use a simple test automation script written in TypeScript to make a API request.
Sample code
import { expect, test } from "@playwright/test";

test("check heart beat google.com", async ({ request }) => {
  const response = await request.get("https://www.google.com");
  expect(response.status()).toBe(200);
});
The script initiates a GET request and verifies that the response status is
200.
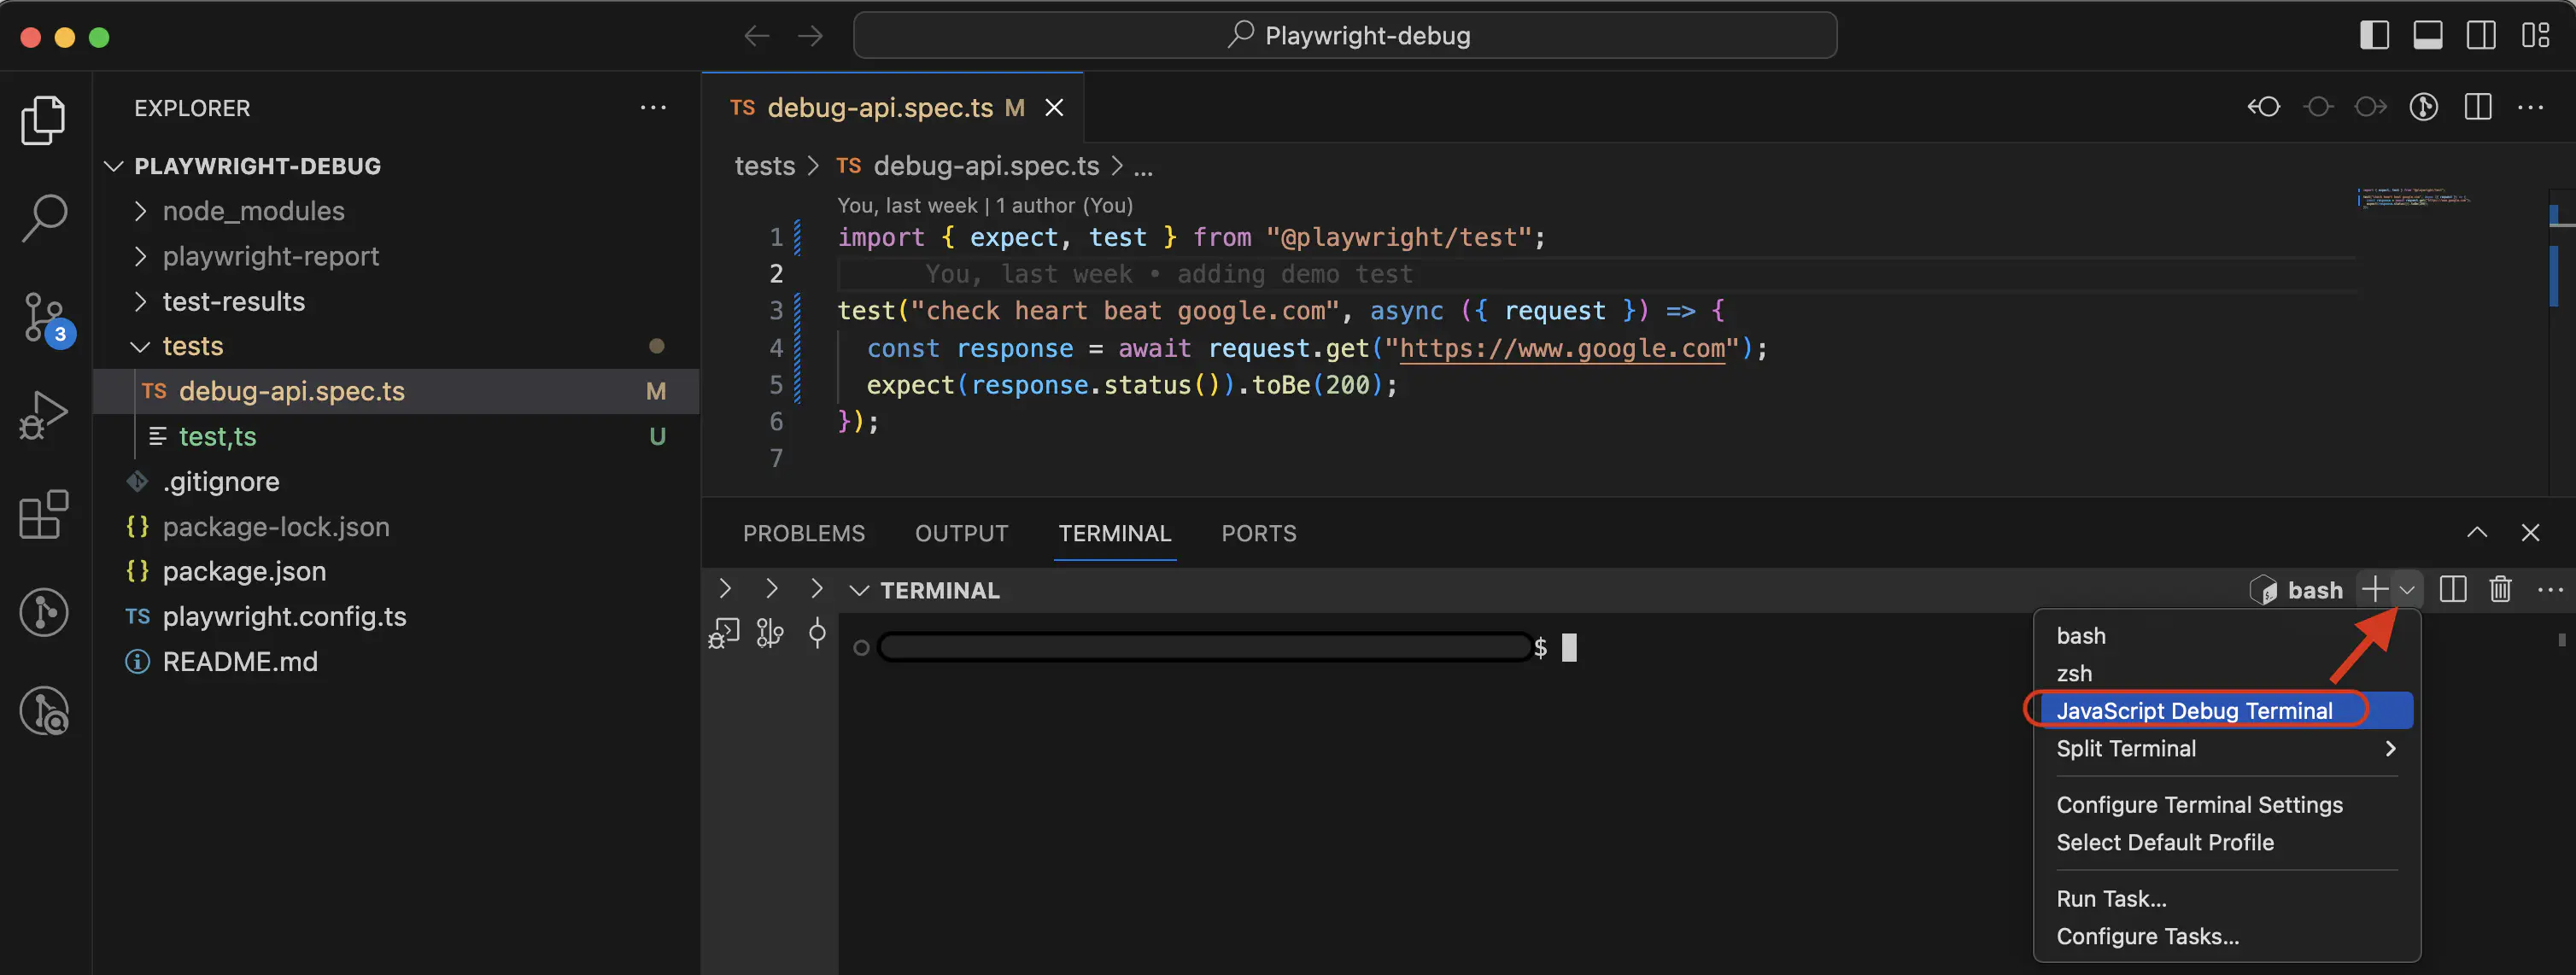
Step 2: Debug terminal in VS Code
Launch your project in VS Code and then open the JavaScript Debug Terminal.
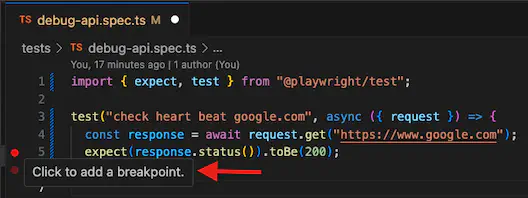
Step 3: Add a breakpoint
Setting a breakpoint in your test automation script is straightforward and enables you to pause the execution, facilitating code inspection.
Position the breakpoint at line #5, then click on the left-hand side of the editor to set a red dot, marking it as a breakpoint.
Step 4: Start debugging
Run the test script using npx playwright on JavaScript Debug Terminal and VS Code will launch the test runner in debug mode.
When the test runner encounters the breakpoint, it will halt execution, prompting VS Code to open the ‘Run and Debug’ section automatically.
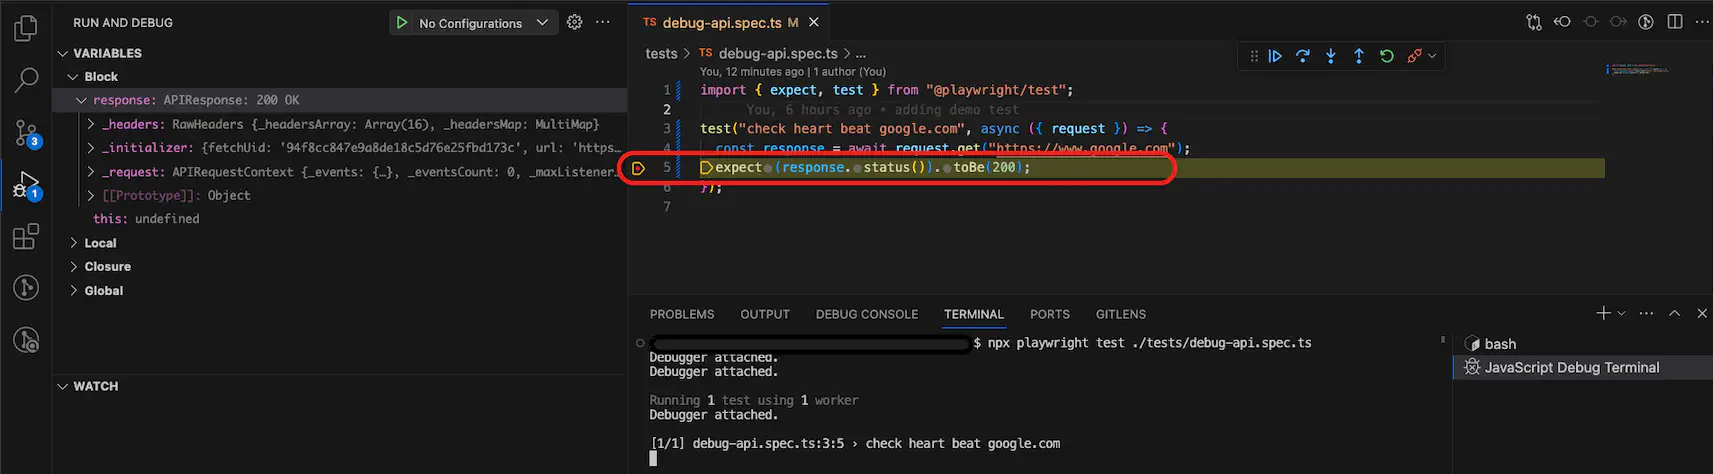
Step 5: Debug the code
In the ‘Run and Debug’ section, you’ll have visibility into variable values and the ability to monitor expressions, enhancing your ability to troubleshoot effectively.
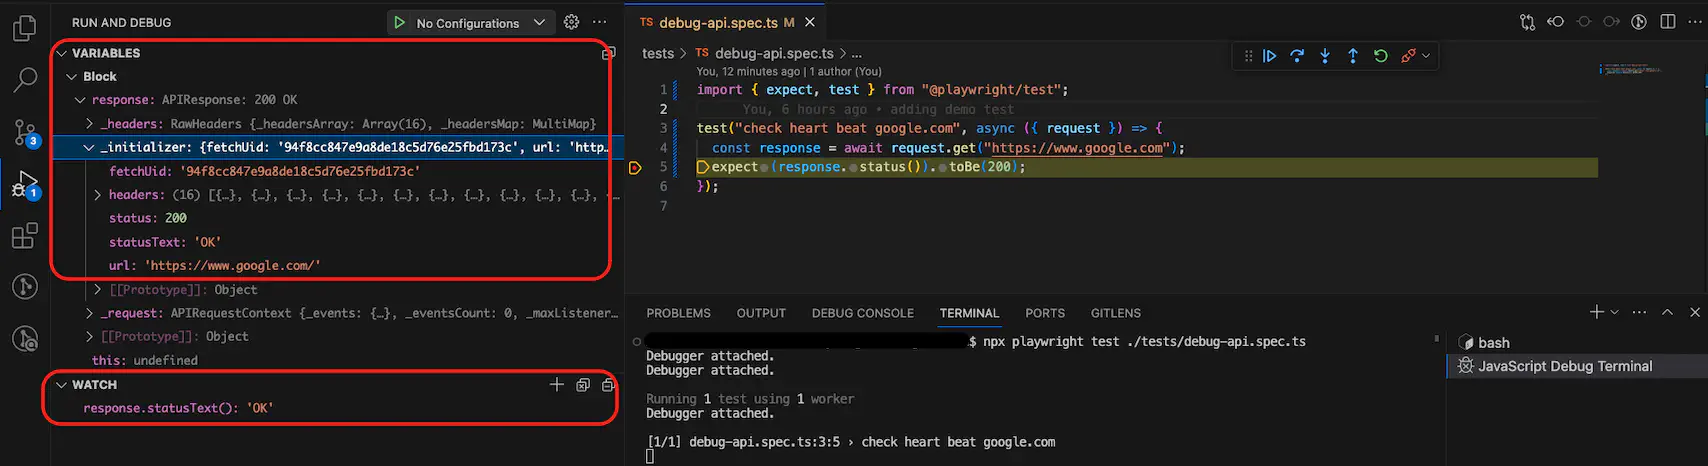
Press the Step Over button, or use the shortcut F10 to execute the current line of code and proceed to the next step in the execution sequence.
Step 6: Continue the execution
After conducting a comprehensive review of the variables, you have the option to either continue execution or, if another breakpoint is set, the execution will pause until it reaches that point, allowing for a repeat of the debugging process.
Cheers! 🙌🏼