Generating graphs for K6 run
Guide to generate cool graphs 📈 after K6 run
The Introduction
Load testing is a crucial aspect of web and API based application development as it helps business to identify and address performance issues before an application goes live.
While k6 is a popular tool for load testing, it lacks built-in graphing capabilities when running locally.
Instead, it allows you to export test results in multiple formats including CSV format.
In this article, we'll take a look at how to convert k6 run CSV test results into graphs and then leverage Jmeter to plot. Lets do it !
Prerequisites:
- K6
- Python3
- Jmeter + any Jmeter graph plugins
Step 1: Export Results in CSV Format
The first step is to run your k6 tests and export the results in CSV format.
You can do this by running the following command:
k6 run --out csv=path/to/results.csv script.js
This command will run your k6 script and save the results in a CSV file located at the specified path.
Step 2: Convert CSV to JMeter-Compatible CSV
Since we'll be using JMeter's graph generator plugin to create graphs, we need to convert the k6 CSV results to a format that JMeter can understand.
To do this, we'll use a Python3 script.
Here's a script that converts k6 CSV results to a JMeter-compatible CSV:
pythonimport csvimport reoutput_rows = []k6_file = 'result/k6_demo_output.csv'output_file = 'result/converted.csv'convertible_names = ['.*']def convert_to_jmeter_row(row):timestamp = int(row['timestamp']) * 1000elapsed = int(float(row['metric_value']))label = row['metric_name']responseCode = '200'responseMessage = 'OK'threadName = row['scenario']dataType = 'text'success = 'true'failureMessage = ''bytes = 1sentBytes = 2grpThreads = 1allThreads = 1url = row['metric_name']Latency = elapsedIdleTime = 0Connect = 0return [timestamp,elapsed,label,responseCode,responseMessage,threadName,dataType,success,failureMessage,bytes,sentBytes,grpThreads,allThreads,url,Latency,IdleTime,Connect]def in_row(row_name):for row in convertible_names:if re.match(row, row_name):return Truereturn Falsewith open(k6_file, newline='') as file:reader = csv.DictReader(file, delimiter=',')for row in reader:if in_row(row['metric_name']):output_rows.append(convert_to_jmeter_row(row))with open(output_file, 'w', newline='') as file:writer = csv.writer(file)writer.writerow('timeStamp,elapsed,label,responseCode,responseMessage,threadName,dataType,success,failureMessage,bytes,sentBytes,grpThreads,allThreads,URL,Latency,IdleTime,Connect'.split(','))for row in output_rows:writer.writerow(row)
Save this script to a file, say convert.py, and update the convertible_names to include the regular expressions you wish the script to match on. In the example above we're including all ('.*') which will pull in
additional metadata unrelated to response such as vus_max. We'd recommend to use this script with custom names that are set using K6 Trends. Otherwise, K6 aggregates everything into http_req_duration.
To run the script:
python convert.py
This script will convert the k6 CSV results to JMeter-compatible CSV and save them in a new file located at the specified path.
Step 3: Import CSV in JMeter and Create Graphs
Once you have the JMeter-compatible CSV file, you can import it into JMeter and use JMeter's graph generator plugin to create graphs.
Here's how to do it:
- Open JMeter.
- Right click on Test Plan, Add -> Listener -> Desired Graph
- Set the filename to the path of your converted K6 CSV file
- Hit enter
And that's it! 🙌🏼
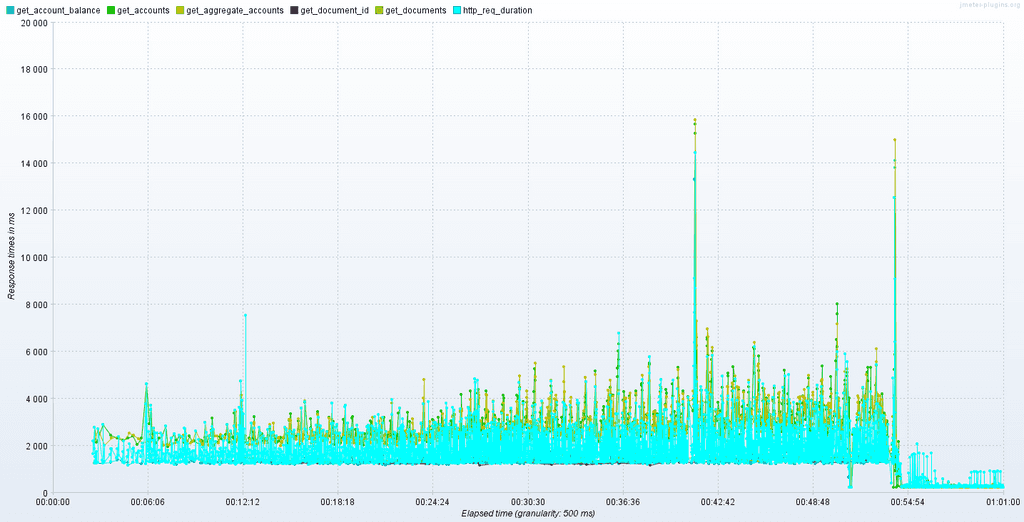
With these simple steps, you can easily convert k6 run CSV test results into graphs using JMeter's graph generator plugin.
Happy performance testing and result analysis!
Everything You Want To Know About Media Queries and Responsive Design
Mock Testing with Stoplight Prism
Our Partners