Guide to generate cool graphs 📈 after K6 run
Table of Contents
The Introduction
Load testing is a crucial aspect of web and API based application development as it helps business to identify and address performance issues before an application goes live.
While k6 is a popular tool for load testing, it lacks built-in graphing capabilities when running locally.
Instead, it allows you to export test results in multiple formats including CSV format.
In this article, we’ll take a look at how to convert k6 run CSV test results into graphs and then leverage Jmeter to plot. Lets do it !
Prerequisites
- K6
- Python3
- Jmeter + any Jmeter graph plugins
Step 1: Export Results in CSV Format
The first step is to run your k6 tests and export the results in CSV format.
You can do this by running the following command:
k6 run --out csv=path/to/results.csv script.js
This command will run your k6 script and save the results in a CSV file located at the specified path.
Step 2: Convert CSV to JMeter-Compatible CSV
Since we’ll be using JMeter’s graph generator plugin to create graphs, we need to convert the k6 CSV results to a format that JMeter can understand.
To do this, we’ll use a Python3 script.
Here’s a script that converts k6 CSV results to a JMeter-compatible CSV:
import csv
import re
output_rows = []
k6_file = 'result/k6_demo_output.csv'
output_file = 'result/converted.csv'

convertible_names = ['.*']

def convert_to_jmeter_row(row):
    timestamp = int(row['timestamp']) * 1000
    elapsed = int(float(row['metric_value']))
    label = row['metric_name']
    responseCode = '200'
    responseMessage = 'OK'
    threadName = row['scenario']
    dataType = 'text'
    success = 'true'
    failureMessage = ''
    bytes = 1
    sentBytes = 2
    grpThreads = 1
    allThreads = 1
    url = row['metric_name']
    Latency = elapsed
    IdleTime = 0
    Connect = 0
    return [timestamp,elapsed,label,responseCode,responseMessage,threadName,dataType,success,failureMessage,bytes,sentBytes,grpThreads,allThreads,url,Latency,IdleTime,Connect]

def in_row(row_name):
    for row in convertible_names:
        if re.match(row, row_name):
            return True
    return False

with open(k6_file, newline='') as file:
    reader = csv.DictReader(file, delimiter=',')
    for row in reader:
        if in_row(row['metric_name']):
            output_rows.append(convert_to_jmeter_row(row))

with open(output_file, 'w', newline='') as file:
    writer = csv.writer(file)
    writer.writerow('timeStamp,elapsed,label,responseCode,responseMessage,threadName,dataType,success,failureMessage,bytes,sentBytes,grpThreads,allThreads,URL,Latency,IdleTime,Connect'.split(','))
    for row in output_rows:
        writer.writerow(row)
Save this script to a file, say convert.py, and update the convertible_names to include the regular expressions you wish the script to match on. In the example above we’re including all ('.*') which will pull in
additional metadata unrelated to response such as vus_max. We’d recommend to use this script with custom names that are set using K6 Trends. Otherwise, K6 aggregates everything into http_req_duration.
To run the script:
python convert.py
This script will convert the k6 CSV results to JMeter-compatible CSV and save them in a new file located at the specified path.
Step 3: Import CSV in JMeter and Create Graphs
Once you have the JMeter-compatible CSV file, you can import it into JMeter and use JMeter’s graph generator plugin to create graphs.
Here’s how to do it:
- Open JMeter.
- Right click on Test Plan, Add -> Listener -> Desired Graph
- Set the filename to the path of your converted K6 CSV file
- Hit enter
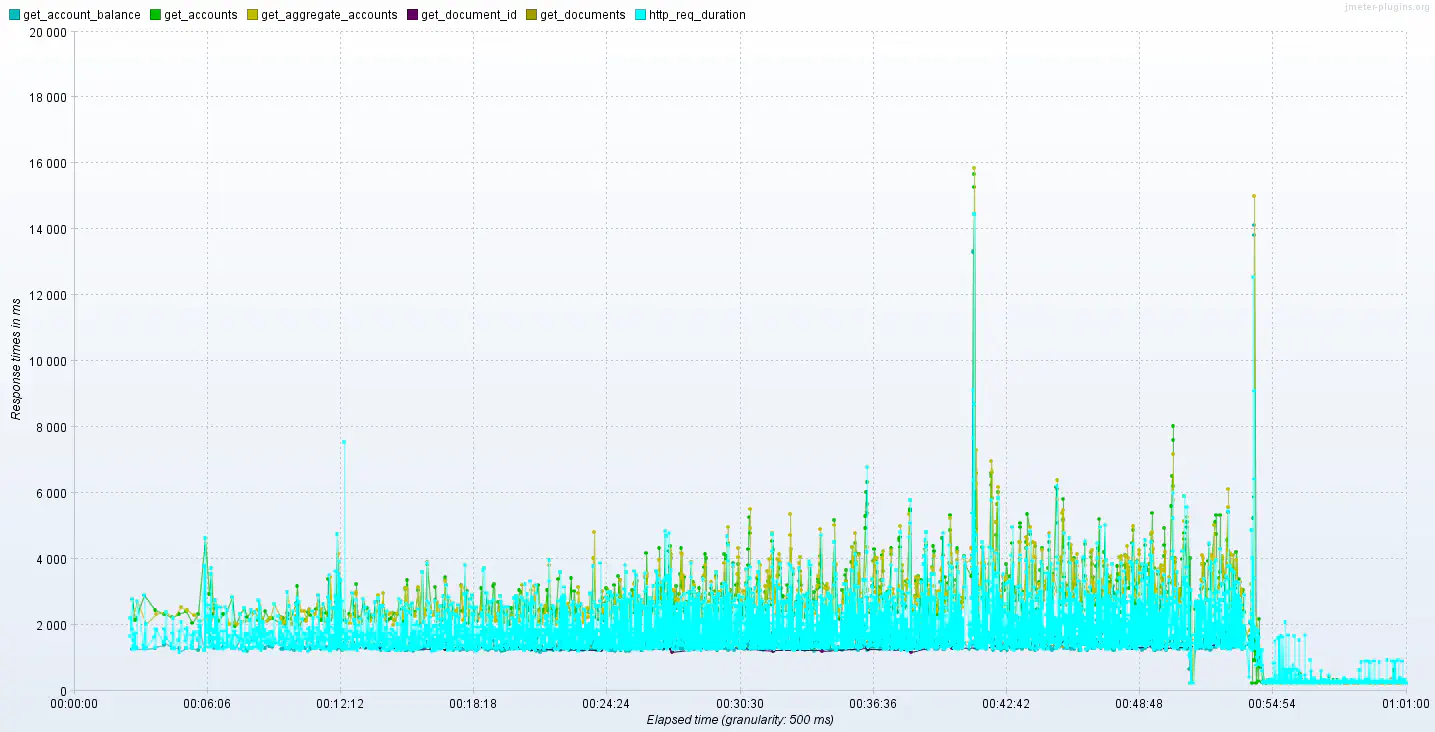
With these simple steps, you can easily convert k6 run CSV test results into graphs using JMeter’s graph generator plugin.
Happy performance testing and result analysis!