What are spectral indices in remote sensing?
Table of Contents
What are Spectral Indices in Remote Sensing?
Spectral Indices are a set of mathematical equations performed on a per-pixel basis on data coming from multispectral remote sensing (satellite) data.
When looking at satellite data, you don’t get a single image, you get all the red data, all the blue data, all the green data, right through infra-red up to ultraviolet. Then you apply a formula to each pixel to pull out information you want.
For example, to get a true colour image, depending on the source data, you might add the red, green and blue pixel values together. (Sometimes the formula is a bit more complicated than that to correct for atmospheric distortion or to amp up the colours.)
A spectral index is a formula that helps different phenomena on the ground be perceived. You can detect things like soil moisture, “greeness” - which can be a proxy for biomass, the composition of the land - such as ferric oxide, flooding, and even tracking seaweed in the ocean.
A lot can be inferred from this data, and it is absolutely fascinating to go down rabbit holes in this area.
How a remote sensing spectral index is calculated?
Let’s take one of the more popular indices - NDVI (Normalised Difference Vegetation Index) - and walk through an example.
NDVI is a widely-used metric for quantifying the health and density of vegetation and is given as a value between -1 and 1, i.e. normalised.
The formula for calculating NDVI is
NDVI = (NIR - Red) / (NIR + Red);
Where NIR is Near InfraRed
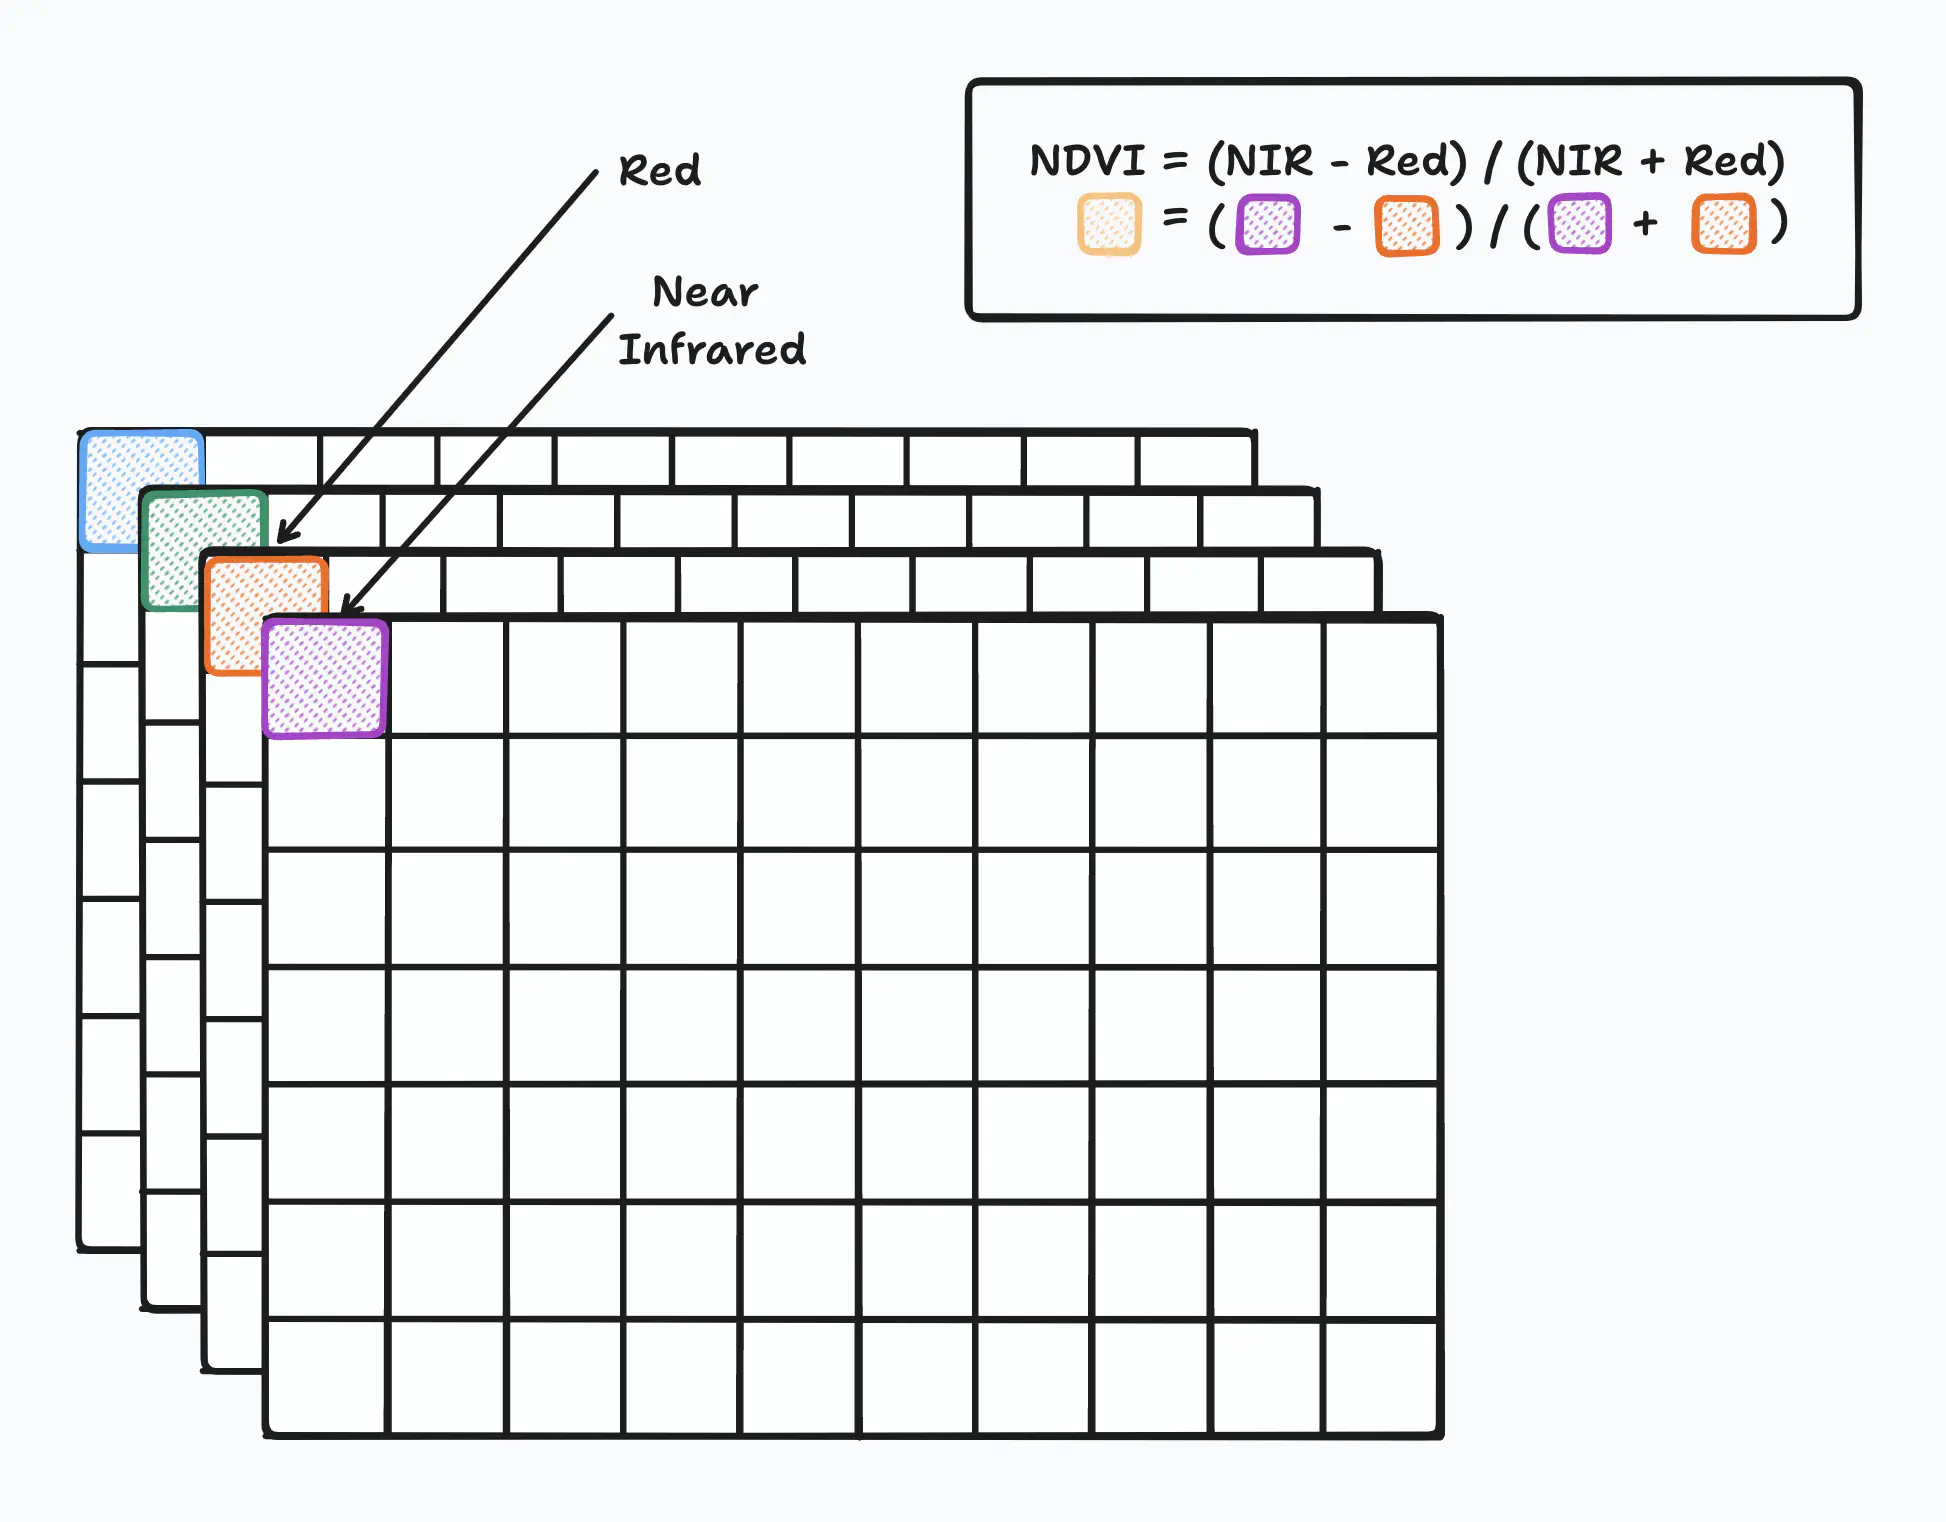
In the figure above, we’re looking at the same image across 4 bands representing Blue, Green, Red, and Near Infrared.
To get the value for the NDVI, we take the values from the Red and Near Infrared bands and apply the formula to them to return the NDVI pixel value.
What does this mean?
It means for every pixel in an image produced by a satellite, we run this formula over it and produce a new value which results in a new image with certain characteristics amplified.
NDVI will produce an image where pixels values:
- Negative values of NDVI (values approaching -1) correspond to water.
- Values close to zero (-0.1 to 0.1) generally correspond to urban or barren areas of rock, sand, or snow.
- Low, positive values represent shrub and grassland (approximately 0.2 to 0.4)
- High values indicate temperate and tropical rainforests (values approaching 1)
There are many limitations to this specific index, and it’s often necessary to modify this formula or use it in conjunction with other indices or data sources to get a true understanding of what is happening on the ground with regard to vegetation.
Importance and applications of remote sensing spectral indices
Remote sensing spectral indices are incredibly valuable tools with a wide range of practical applications. These indices help us explore the environment further and gather valuable insights.
For example, by analysing soil moisture levels, we can make informed decisions about irrigation and agricultural practices.
Monitoring vegetation health and density helps us understand ecosystem vitality and identify areas that may need conservation efforts.
By understanding vegetation and dryness in the land, it can inform the likelihood of fire breaking out in the landscape during the increasingly dangerous and prolonged fire seasons across the globe.
Additionally, remote sensing spectral indices aid in assessing land composition, which is crucial for urban planning and resource management.
We can even detect and monitor algae blooms in oceans, which is essential for protecting marine life and maintaining healthy ecosystems.
By harnessing the power of satellite data and mathematical formulas, these indices empower researchers, scientists, and environmentalists to make informed decisions and contribute to the preservation and sustainable management of our planet’s resources.
Increasingly they can be used in industry, putting the insights derived from these indices into the hands of people and businesses who are affected by the real world impacts which the indices can highlight, like flood and fire risk.
Common examples of remote sensing spectral indices
Limitations and considerations when using remote sensing spectral indices
Reliability
There are many factors that can affect the quality of the remote sensing data. Things like cloud cover, atmospheric interference, sensor calibration, and spatial and temporal resolution all can affect how reliable the data is. It is important to approach the resulting data with those factors in mind, there is a certain level of interpretation needed to draw conclusions from the indices.
Different strokes for different folks
Spectral indices are designed to capture specific phenomena or characteristics, and their effectiveness may vary depending on the target application. It is important to select the appropriate index that is most relevant to the objective you’re trying to achieve which may change depending on what you’re observing such as different indices for different vegetation types.
Telling the whole story
To tell the whole story, spectral indices should not be used in isolation but rather in combination with other data sources and analysis techniques. Integration with ground truth data and field measurements can help validate the results and provide a more comprehensive understanding of the environment.
Conclusion
Remote sensing spectral indices are powerful tools that allow us to extract valuable information from multispectral remote sensing data. They provide insights into various environmental phenomena, such as vegetation health, soil moisture, and land composition. By analysing these indices, we can make informed decisions in areas like agriculture, conservation, urban planning, and emergency and resource management.
However, it is important to consider the limitations of spectral indices, such as data reliability and the need for complementary data sources and analysis techniques.
By harnessing the potential of remote sensing spectral indices, we can contribute to the understanding, preservation, and sustainable management of our planet’s resources.