Optimising Playwright Reporting Through Monocart

Table of Contents
One of the critical challenges in automation testing is finding a reporting tool that provides a comprehensive view of test execution. After trying several tools, I found that Monocart not only solved my reporting issues, but also significantly improved our Playwright automation framework. We’ve built a robust automation framework for our front-end applications and back-end services using Playwright, and most of these tests run during build deployments. However, Playwright lacks a cloud dashboard for uploading test results, which could enhance our testing process. With Monocart, we now have a powerful reporting tool that provides a cloud dashboard for test results, improving the scalability and reliability of our test suites.
Monocart
Monocart reporting tool is a cutting-edge software solution designed to streamline and simplify generating and analyzing test execution reports. One of its key features is its user-friendly interface, which empowers users to navigate and understand the test run easily. This interface makes it easy to view the number of tests that passed and failed, apply filters to find specific information, and customize the report to suit your needs. It also generates detailed and visually engaging automation test reports, allowing users to customize and integrate them with other test management tools.
Playwright
Playwright is a powerful automation library for web browsers developed by Microsoft. It’s a tool developers and testers can rely on to automate web browser interactions. This enables the creation of reliable and scalable test suites. Playwright is a versatile tool that supports various programming languages such as JavaScript, TypeScript, Python, and C#. It provides a unified API to interact with web pages across different browsers, including Chromium, Firefox, and WebKit. Playwright plays a crucial role in our automation testing process, and Monocart enhances its capabilities by providing a powerful reporting tool.
Why is Monocart a good reporting tool
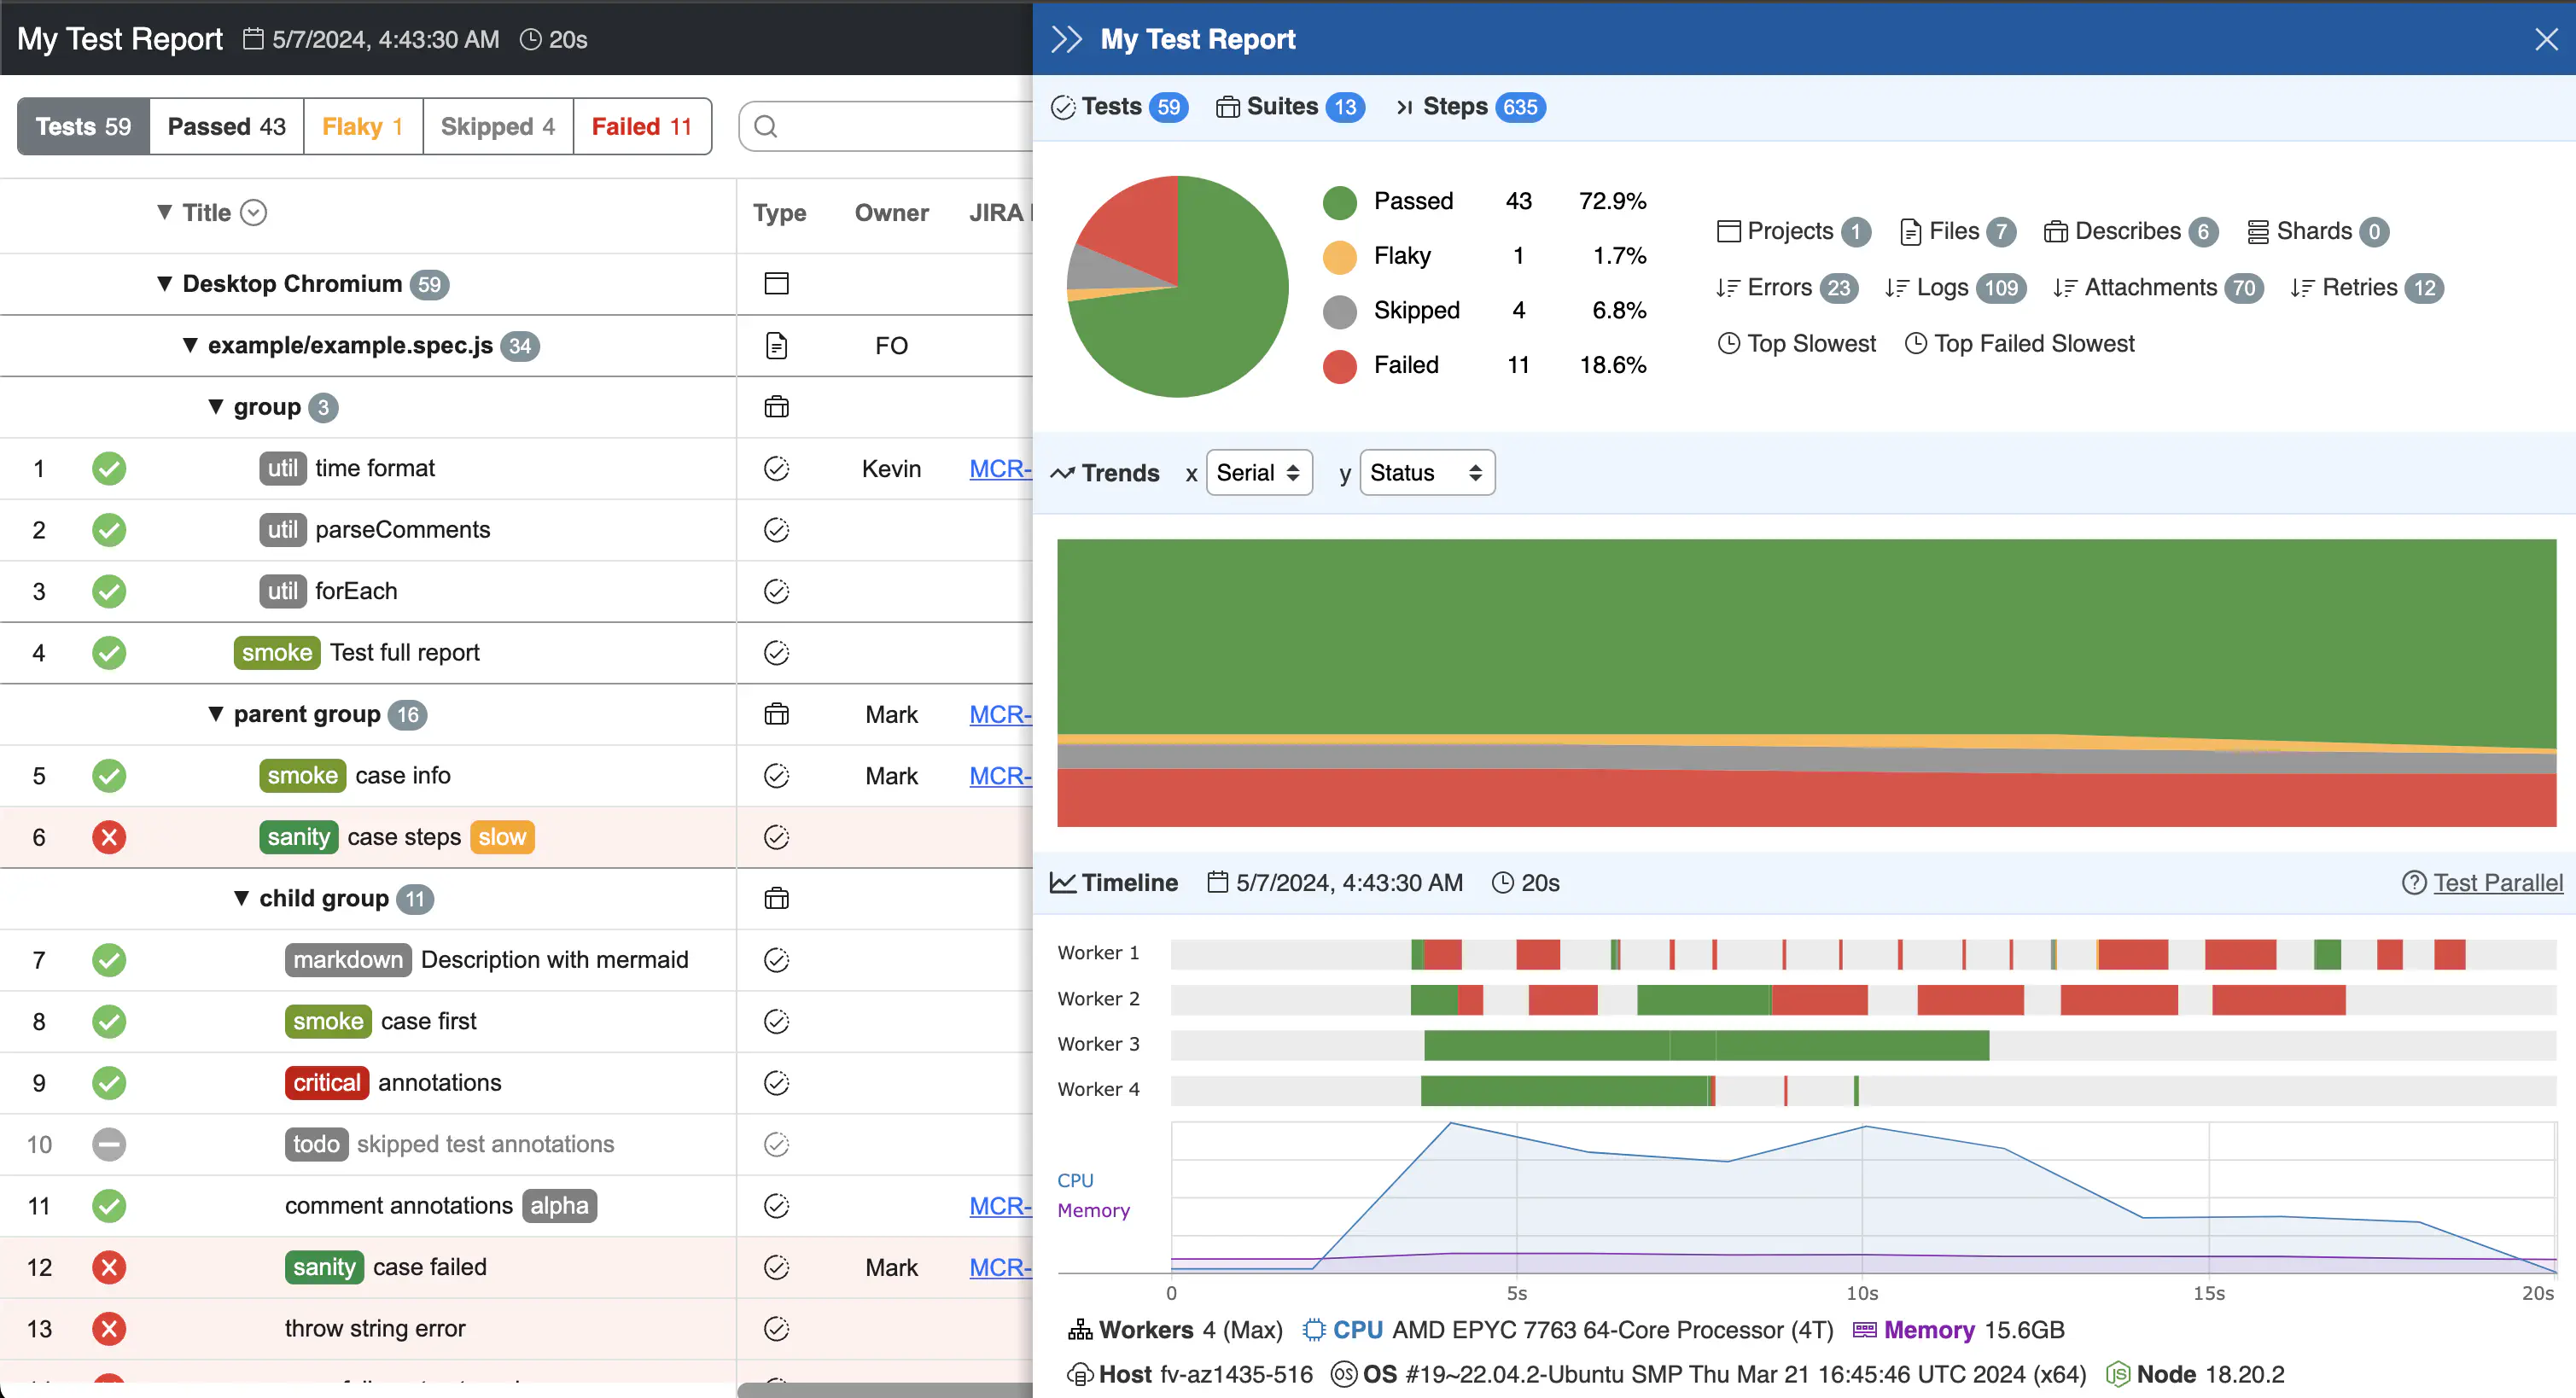
Monocart report outputs a pretty report that gives a great picture of test execution. It is straightforward to view the number of tests that passed and failed. The report will have various filters, such as passed, failed, skipped, flaky, suite, and tests. Users can effortlessly find precisely what they are looking for by utilising these filters.
You can generate reports without downloading or installing any additional software. You need to add Monocart details to the Playwright config file. Monocart is an open-source tool, which means it’s freely available and transparent. This open-source nature ensures that no subscriptions are needed, providing a sense of reassurance and confidence in its reliability. It also allows for community contributions and continuous improvement, making it a reliable choice for your automation testing needs.
Reviewing and promptly debugging test failures is a critical part of our testing process. Monocart simplifies this process by providing detailed reports categorising test failures as bugs or broken tests. It also allows for the configuration of logs, steps, fixtures, attachments, timings, history, and integrations with Test Management Systems (TMS) and bug-tracking systems. This ensures that responsible developers and testers have all the necessary information readily available for effective issue resolution, reducing the time it takes to resolve common defects.
Monocart reports provide stakeholders with a clear overview of the covered features, the clustering of defects, the execution timeline, and other relevant information. The modularity and extensibility of monocart ensure that you can always make adjustments to suit your needs better.
Each failure to have a stack trace.
The report can be customisable with the desired field.
Steps to Integrate with Playwright
Install monocart-reporter as dev dependency
npm i -D monocart-reporter
Integrating Monocart with Playwright is a simple process. First, add the Monocart reporter to your Playwright config file. Then, specify the name and output file for your test report. Once these steps are complete, you can generate comprehensive reports with Monocart.
module.exports = {
    reporter: [
        [`monocart-reporter`, {
            name: `My Test Report`,
            outputFile: `./test-results/report.html`
        }]
    ]
};
Additional configurations can be available here: https://github.com/cenfun/monocart-reporter
How to generate reports while running tests in CICD
We utilise the AWS CodeBuild / CodePipeline as our CICD tool for the project, but the following steps apply to any CICD tool.
Step 1: Setting up Buildspec
Setting up a buildspec.yml file for AWS CodeBuild involves defining the build commands and instructions necessary to run the build process. Here’s a basic guide on how to create a buildspec.yml.:
a. Create a buildspec.yml file
b. Specify the version of the build spec
yaml version: 0.2
AWS CodeBuild supports two versions of the build spec syntax: 0.1 and 0.2. The 0.2 version provides more flexibility and additional features compared to the 0.1 version.
c. Define build phases
Ensure that the `buildspec.yml` includes the declaration of build process phases. These typically encompass `install`, `pre_build`, `build`, `post_build`, and `artifacts`.
Below is the example of my sample project Buildspec
version: 0.2

env:
  variables:
    BASE_URL: $BASE_URL
    EXAMPLE_VARAIBLE: $VARIABLE

phases:
  install:
    commands:
      - echo "--> Install Node"
      - n 20

  pre_build:
    commands:
      - 'echo "NPM version: "'
      - npm --version
      - npm clean-install

  build:
    commands:
      - cd app/web-integration-tests
      - npx playwright install
      - 'npx playwright test -g'
    finally:
      - cd ${CODEBUILD_SRC_DIR}/web-integration-tests/test-results
      - aws --region ap-southeast-2 s3 sync ./ s3://${directory}/${CODEBUILD_BUILD_ID#*:}/
      - echo "Find the test results uploaded to S3 bucket url"
Step 2:
Start Execution:
When changes are detected, the pipeline automatically triggers and executes tests or we trigger build manually by clicking start build.
Step 3:
Monitor Pipeline Execution:
Go to the CodePipeline console to monitor the progress of your pipeline. You can view the status of each stage and action within the pipeline.
Step 4:
At the end of the execution we will have url to access report that will be printed in the logs.

How to view the report
Go to the test-results folder and open report.html file. A nice report should be opened using the system’s default browser.
Conclusion
Monocart offers a range of features that enhance the reporting and analysis of test execution. These include trend charts that show the progress of your tests over time, code coverage reports that highlight the areas of your codebase that are tested, email notifications that keep you updated on test results, and integrations with popular test management tools. I’m still exploring these features and will write more blog posts about them soon.