How Satellite Data and AI Can Shield Australia’s Hunter Valley Wine Industry
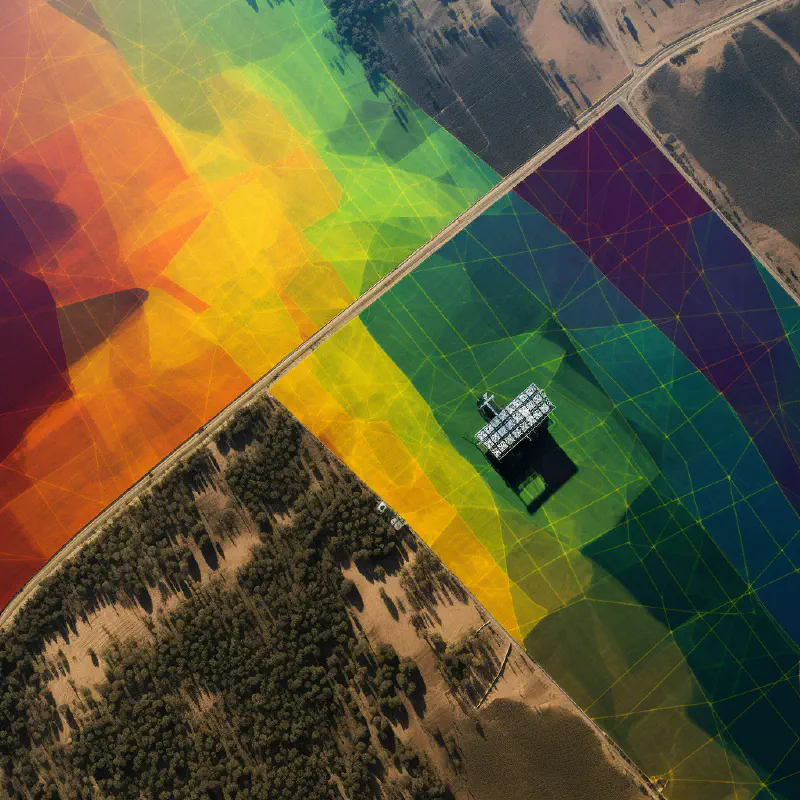
Table of Contents
Bushfires, smoke, droughts… As you prepare to enjoy a delightful sip from your glass of Australian Sémillon this afternoon, take a moment to reflect on the remarkable journey of resilience it has undertaken before gracing your table.
The Climate Challenge: The Intersection of Climate Change and Wine Production
Ranked as the 5th largest global wine exporter, Australia holds a prominent place in the world of wine. The Hunter Valley, Australia’s oldest wine-producing region situated just a couple of hours north of Sydney, is facing a substantial challenge. According to Wine Australia’s Climate Atlas, this region is anticipated to experience an average temperature rise of 2.3 degrees Celsius over the next 50 years. This brings unpredictable weather patterns and an escalated risk of bushfires driven by the intensifying heat. The Hunter Valley is already confronted with an increasing vulnerability to bushfires, a threat that magnifies in the face of climate change.
The risk doesn’t solely arise from direct fire impact. Beyond the vineyards that are directly impacted by flames, the danger comes as well from smoke emanating from nearby blazes. “Smoke taint,” a phenomenon arising when smoke particles adhere to grape skins, compromises the quality of wine produced from these grapes, leading to substantial harvest losses.
As the El Niño phenomenon approaches in the summer of 2023, there is a dual concern of record-breaking warmth and extreme aridity. Elevated fuel accumulation, dryness, fire-conducive weather, and lightning activity collectively heighten the probability of frequent bushfires. Consequently, the convergence of drought, parched vegetation and unprecedented heat could imperil the wine industry. Mitigating such risks necessitates effective fire prevention strategies, precise risk assessment, and strategic hazard reduction efforts.
Nature’s Watchful Eye: Harnessing Satellite Data for Land Health Assessment
Satellites play a pivotal role in the toolkit of scientists, enabling them to monitor Earth’s atmosphere, terrain, and oceans. The Sentinel-2, a component of the European Copernicus Programme named in honour of Polish astronomer Nicolaus Copernicus, is an Earth observation mission that captures optical images with a high spatial resolution (ranging from 10 metres to 60 metres) over both land and coastal waters. With a constellation of two polar-orbiting satellites, Sentinel-2 provides data every 5 days.
Sentinel-2 leverages visible, near-infrared, and shortwave infrared sensors across 13 spectral bands. Here, a colour composite combines a few of the spectral bands — visible red, green and blue bands — with the corresponding red, green and blue channels, resembling what you would see with the human eye.
These 13 bands facilitate the computation of indices that estimate vegetation health, detect changes in the landscape, and even estimate the risk of bushfires. One of the invaluable indices derived from Sentinel-2’s spectral bands is the Enhanced Vegetation Index (EVI). Tailored to enhance the visibility of vegetation while minimising atmospheric interference, EVI offers insights into vegetation health. Healthy, green and hydrated vegetation corresponds to higher EVI values, while drier, less healthy vegetation, indicative of bushfire risk, corresponds to lower EVI values.
An illustrative divergence is visible in the comparison between unhealthy and dry vegetation during the 2019–20 Australian bushfire season (Black Summer) and flourishing vegetation in December 2021.
EVI provides a quantitative measure of vegetation health, allowing wineries to track the overall condition of their entire vineyards, as opposed to individual vines. This can help identify early signs that might not be immediately obvious to the naked eye. By tracking EVI trends over time and comparing them to historical data, we can identify drought conditions early and alert vineyard managers to take appropriate actions. By analyzing EVI alongside soil moisture data, we can develop irrigation strategies that ensure efficient water use and prevent over- or under-irrigation. EVI data can also detect early signs of potential diseases affecting vineyards - unhealthy vegetation might indicate the presence of pests or diseases.
Pixels to Precision: Refining Analysis: AI-Powered Examination of Individual Fields
Moving beyond regional assessments, a finer-grained evaluation of individual fields is achievable. Given the scarcity of labelled data, an unsupervised approach is adopted to categorize similar agricultural fields based on their EVI and basic spectral bands. This approach rests on the assumption that similar plant types exhibit analogous responses to environmental changes.
Since we lack knowledge of the exact field boundaries, we can use the unsupervised machine learning algorithm, K-means clustering, to partition unlabelled data points into K clusters predicated on their similarity. In the context of Sentinel-2 data, K-means facilitates the grouping of similar pixels according to their spectral characteristics and EVI values.
The outcome of K-means clustering is cluster labels that assign each data point to one of the K clusters. K-means is basically like sorting coloured balls into groups by finding their average colours. In the realm of Sentinel-2 data, these labels serve to identify areas characterised by similar spectral attributes. These areas can then be subjected to further examination for valuable insights, such as land use classification and environmental monitoring, and as input to the segmentation algorithm.
In order to extract individual fields for an even higher resolution, to facilitate analysis of individual fields, we can use Felzenszwalb’s algorithm, a segmentation technique widely employed in image processing and computer vision.
This algorithm functions as a bottom-up segmentation tool, aggregating pixels with similar characteristics and spatial proximity into segments or regions. It’s like drawing lines around squares of similar colours in a picture to make shapes. This method facilitates the extraction and analysis of individual fields for future investigations, such as precision agriculture management, crop yield prediction or individual field risk assessment.
Estimating Bushfire Risk: An Advanced Application of Satellite Data
There is the potential for satellite data to be used in proactive bushfire management. Satellite imagery empowers us to assess both individual fields and entire regions for their bushfire susceptibility as well as, with the power of AI, forecast vegetation health, drought conditions and disease outbreaks.
The Bushfire Risk Estimation can be calculated using the already mentioned EVI index, alongside other indices calculated from satellite bands, such as the Normalised Difference Water Index (indicative of liquid water presence), the Normalised Burn Ratio (used to identify burned areas and quantify burn severity), and current surface temperature.
In addition, these indices and satellite data play a crucial role in aiding state and federal government agencies in enhancing industry resilience, planning for disaster preparedness, and in pre-positioning resource allocation for recovery activities. This collaborative approach ensures the preservation not only of the Hunter Valley’s wine industry but also of other vital sectors vulnerable to the challenges posed by our rapidly changing climate.