Performance test tool comparison
Introduction
Getting started with performance testing can be tricky as there is not much information out on the web as compared to automation. In this article I’ll be going through some of the popular tools out there, what problems they solve and what advantages they each have. With these details someone can pick the tool that suits them and try writing a script considering it’s no more difficult than writing an automation script.
Starting point
The first question you need to ask is what problem am I trying to solve? A tool is built to solve for a particular problem and performance test tools are no different. A hammer is built to hit things, a saw to saw through things. You can use a saw to hammer in nails but it’s not really ideal.
If you only need to worry about testing back end APIs, then don’t bother looking for a tool that will do browser recording. If your main concern is browser performance then look at getting a browser performance tool rather than a tool that focuses on response times.
Choosing a tool
Once you understand what your problem is then you can look at the core features each tool needs to solve. In performance testing there are 2 main types of tests that I’ve come across. Either it’s an end to end user journey or it’s focusing on the API response times.
Sometimes a test requires a bunch of end to end actions with an API call mixed in there somewhere (like kicking off a batch job) but ultimately it’s the former cases you need to be concerned with. The best mentality I have when deciding on what to use is, use the free stuff until it can’t do what you want.
From experience, most performance requirements require HTTP requests and it’s best to start with the easy protocols like HTTP before moving onto some of the less intuitive ones. Below are the features you always want in a tool.
Core features
- Time to get set up
- Flexibility in creating a user flow
- Costs
- Support
Lower priority features
- Reporting
- Server monitoring via performance tool
- Continuous integration features
- Software as a Solution (Saas)
Avoiding the marketing gimmicks
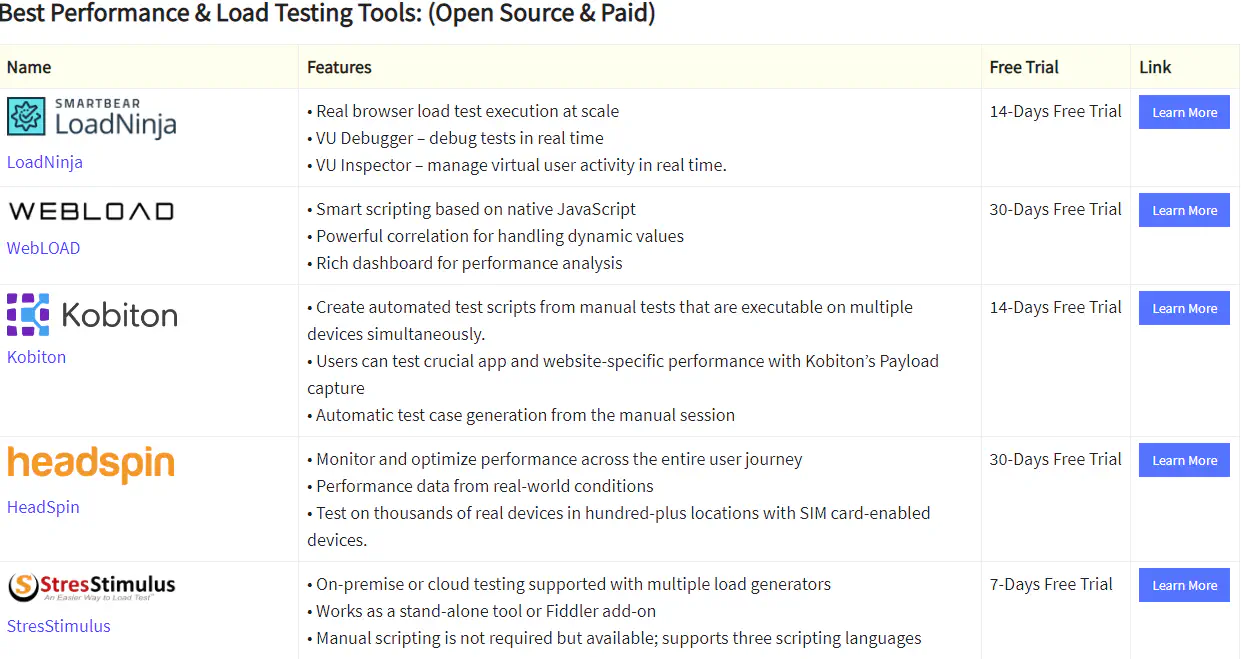
A quick Google search of ‘performance test tools’ will yield various articles claiming what the top tools are for that year or give you a list with a bunch of text padded bullet points describing what it does.
All of these articles are useless. At best it’s copy pasting the marketing info, at worst it’s incorrect info or a paid endorsement (SmartBear products are all suspiciously at the top of these lists). Any of the following terms are red flags: script-less, machine learning, auto-correlating, SLA detection etc.
Other features like infrastructure monitoring, or pipeline integration are not as useful as you might think. For instance there are dedicated infrastructure monitoring tools out there that do a much better job than some tacked on performance test tool. What they can monitor are things that nmon/perfmon can already retrieve and you’re paying for the privilege of saving a couple minutes setting up the recorders.
What actually matters when picking the tool
With the caveats out of the way, I can go a bit deeper into why the 4 topics above are important. The important thing to consider with performance testing is that the tests are often short and infrequent. It’s impractical to focus on tools that offer integration into pipelines when it’s just not a concern for the majority of the software life cycle.
Typically performance testing happens if a major release is coming up, there’s been a major software revision and regression is a concern, or a governance requirement mandates it. Doing a performance test with every release is a waste of resources, both in terms of labour and compute time. In testing it’s not possible to test everything, it’s all about directing resources at the highest impacts or priorities for the piece of software you’re developing.
Cost
Any tool that requires a license will slow down the testing process and so the best course of action is to avoid it completely. From a consultant’s point of view it can take weeks for a tool to get sign-off (Loadrunner is a good example), and you are wasting time waiting for an accountant to rubber stamp an invoice. From a business’s point of view it’s another license that needs to be kept track of and secured.
Setup time
Setup time includes everything from installation, firewall whitelisting and datapool generation. Do you have admin access to the machine? Can the machine access the environment you are trying to test? Do I need to be careful when storing the test data I’m using for my test?
Flexibility in creating a user flow
This is dependent on the skill or familiarity of the tool being used and there’s always a bit of subjectiveness when it comes to this. This can be broken down into key areas to help make the decision such as:
- Can I set X rate per min?
- How easy is it to insert wait time between actions?
- How do I scale up users?
- Can it do parallel requests?
- Is it easy to add uniqueness to the virtual users?
For API testing this is not as big of a factor, but in an end-to-end scenario it’s important and will impact the maintainability of your scripts.
Support
Finally, the amount of support available for the tool will help smooth out any kinks found when developing your scripts. This can be an official avenue such as a service contract with the tool provider, but also consider community sites like Stack Overflow. If you need to raise a support ticket just to get an answer on how to create unique data for your virtual users, it’s going to slow you down. And slowing you down means higher costs.
The (actual) best performance test tools
JMeter. k6. Loadrunner
The best rule to apply when deciding on any software solution is “free until it no longer works”. This means start with JMeter and k6 until it can no longer do what you need, and in 95% of cases they will be able to do it. Some technical skill is required to use these tools — as it should be. Giving a performance test tool to a manual tester and expecting them to give useful results is futile. If a tool does market itself as code-less or downplays the technical skill needed when it comes to interpreting the results from the performance test, the person conducting it will provide inaccurate information.
Deep dive on each tool
JMeter
Java, GUI driven, average recorder, nice plugins, reasonable reporting, completely free
JMeter is probably the most used performance test tool for the simple reason it handles a variety of common protocols with good customization. That, coupled with the fact that most performance tests only require HTTP, and it’s no wonder that JMeter has such a large user base.
Install and scripting
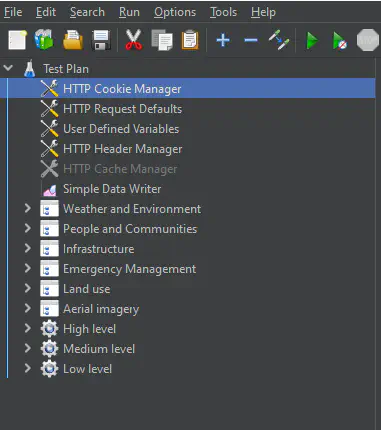
The installation consists of unzipping a .zip and installing Java Runtime Environment (JRE) on the target machine whether it’s Windows or Linux. The simple installation approach makes it possible to create a script file to install across all load generators easily. Since no admin access is required, this can save a lot of headaches when dealing with IT security.
The scripting process can be a bit slow due to the JMeter team focusing on a GUI driven interface. Plus, there is a bit of a learning curve when it comes to understanding how the timers interact with each other to give breaks in between each request.
I would also say that JMeter is very easy to get wrong. Similar to how PHP has the reputation of allowing bad code to exist, in JMeter there is a large amount of customisation for each sampler. It is possible to parameterize them all, but unless you build the script from the start with that in mind, the maintenance can become fiddly quickly.
Recorder
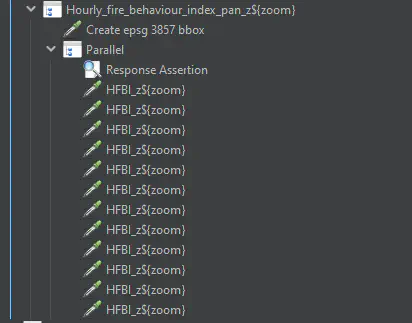
The inbuilt recorder works stock standard, capturing all of the HTTP requests made from the browser, along with any static files and headers. It can become messy as there’s no way to mark what page you’re on within the JMeter recorder, and so all the requests get bundled up into 1 section. There is configuration you can set with the JMeter recorder to bundle up based on the current page URL. However, if there are AJAX calls made on the page, it still clutters up the page segment you’re trying to record.
Executing
Due to JMeter’s simplicity the execution side is very straightforward. If your local machine can handle the required load, you can create a basic CLI command to start the test and output the results. If you need to run a distributed load test the only adjustment needed is to add the server IPs to the end of your command. Debugging is easy because JMeter automatically captures the full request and response details.
Reporting
Out of the box JMeter has okay reporting, but there are a ton of 3rd party plugins available that really enhance what information you need to show. With these plugins it can easily do what all the other tools on the market offer.
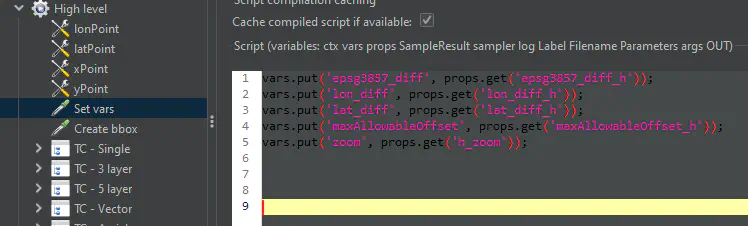
Limitations
To get the most out of JMeter some groovy/Java scripting is necessary. There’s no inbuilt debugger for these script, so either you need to use an IDE, or start putting in print statements like it’s the ’70s. There is no native support for parallel requests which is a common feature in modern web applications. If your only concern is load then you can pseudo-engineer it and have multiple threads batch up, submitting at the same time to replicate parallel requests. But if you want true parallelism you need to download a plugin, and I’ve found that plugin can be a bit buggy when used with large amounts of requests, where a Java exception is thrown occasionally.
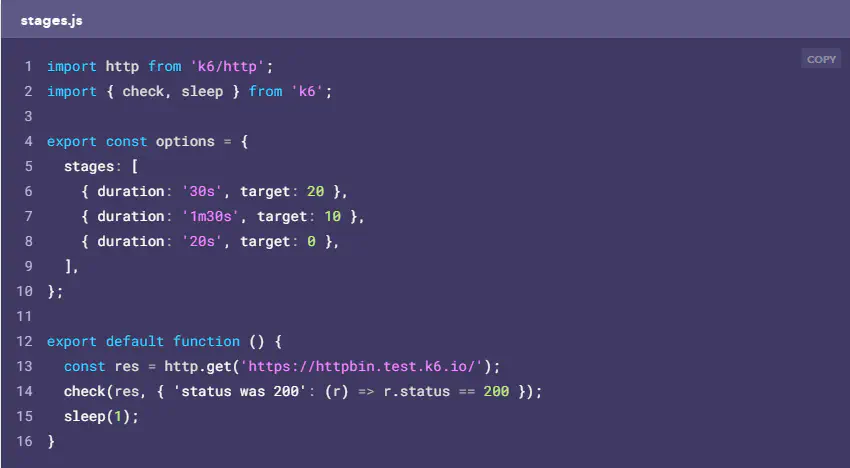
k6
JS based, cmd line only, API testing focused, no distributed testing mode
Install and scripting
k6 is slightly more involved than JMeter when it comes to getting it all set up. There are 2 options, downloading through a package manager such as brew or get the Windows binaries from their GitHub page. If you have control over the environment then it’s a simple CLI command, but if you’re on Windows you will need to run the msi/exe, and this can become an issue in corporate environments where they restrict such things
Recorder
k6 is for API testing and there is no packaged recorder available.
You can use tools such as Fiddler to help record the APIs you want to scrape and build out the tests from there — otherwise it’s converting API docs into JavaScript for k6 to run.
Executing
If you’re running locally, k6 is incredibly fast and efficient which makes testing scripts trivial. But if your local machine cannot output the required load, then you only have the 1 viable option of paying for the k6 cloud service. The cheapest plan is US$90/month which is competitive with other load test tools, but the maximum runtime for a test is 15 minutes which renders it almost useless. This is quite stifling as you will want most of your performance tests running for at least an hour, because you want to gradually increase the load then measure the performance at your target throughput rate. Even at the next tier of pricing you’re only getting 1000 users and 30 minute run duration. And then to top it off they limit the number of times you can run your tests. The amount of runs included is high (900), but it still feels like they’re really trying to extract as much as they can out of you.
Reporting
k6 offers a bit more of a limited set of features for reporting, boiling down to a basic CSV/JSON format and writing it to a simple text file. If you only need percentiles, averages or medians then k6’s default output will suffice. It is possible to setup a dedicated reporting dashboard like Elasticsearch or Grafana, but that is extra overhead on the tester to get running.
Limitations
Aside from the limitations pointed out earlier, k6’s cloud service can only target public facing sites which will restrict any large distributed load testing.
Another issue I’ve experienced with K6 is the default aggregation of the test results. After the test has been completed it will aggregate all requests into the 1 metric which is not useful if you have multiple APIs. To get around this you need to define separate metrics (called a Trend in k6) for each individual API and this gets fiddly quite fast.

Loadrunner
C based, mix of GUI and code, good recorder, firewall handling, expensive
Install and scripting
With our last tool we also have our most complex install. You have to sign up to Microfocus (as of 2023, it will probably get sold again), get a free trial, then download the 1.5GB file to install. Then you need to have admin rights on top, and you’re forced to use windows. If you need additional agents, you’ll also need admin on those machines too, adding further headaches to getting everything set up.
 Scripting is a mixed bag for Loadrunner. There is a wide variety of protocols to choose from and the customization is extensive. However, you are forced to use their odd scripting language that’s been set up. As it was written in C/C++ there are a lot of quirks that the Loadrunner development team had to build to get it into a more script-like language (for example, every action requires a ‘LR_END’ at the end).
Recorder
This is what you’re paying for when you buy a Loadrunner license. This tool handles a huge amount of different protocols. There are the standard HTTP or FTP but more niche ones like Citrix, Websockets and Oracle DB. I also found the recorder was able to record effectively when being used on a typical corporate network. It comes with auto-correlation but it’s inconsistent. The ones that you can manually set up are better and they do speed up the scripting process (especially .NET’s Viewstate), but if it misses one then you’ll lose time to debugging.
Executing
Loadrunner has a poor user experience when either trying to debug scripts locally, or when conducting a performance test as it’s prone to crash far more often than it should. The license required for runs can stretch any deadlines you’ve placed. This is because it will take time for the license to be procured - only for that same license to expire a few months later. If you need multiple machines to generate load, every time that you set up a new agent machine you also need to install the load runner agent. This gets tedious after a couple of times. Loadrunner will try to sell you a product that handles all of this called Performance Center but it’s slow and the script check-in process is very clunky. Finally, if a run crashes halfway through your test, the partial results are lost and you need to redo the test.
Reporting
Along with the recorder, the reporting is why Loadrunner has such a high price tag. I’ve found these to be the best out of the box reports for performance test tools. The formatting is nice, graphs look great and give you a large range of relevant reports for different metrics that you might want to include. It’s the only tool I’ve seen to calculate standard deviation which is useful in understanding the consistency of response times.
Limitations
Aside from the obvious cost, you will also need a Microfocus account to get the Loadrunner download. Admin access is also required on the machines you wish to install Loadrunner on, and depending on the organisation you’re working for, this can take a couple weeks.
Conclusions
In conclusion, what tool you go for depends on your familiarity with the underlying programming language, what problem you’re trying to solve, and if you want a GUI or not. Start with the free tools where you can try out what works and then look into any paid products if the free solutions don’t quite fit. And most importantly, start simple and build up. It’s always better to start small, gain some experience, then apply what you’ve learned to the next performance test.